![]()
Investigators of the Geographical Institute at the Slovenian Academy of Sciences and Arts (now: GIAM ZRC SAZU) made marker signs at the edge of the glacier and began to measure distances of the glacier end in 1946. This was the basis for publishing a sketch of the glacier's size for each year from 1946 to 1952 (Meze, 1955, fig. 22). For the 1954-62 period, the glacier is marked on the photograph with lines for the years 1954, 1958, and 1962 (Šifrer, 1963, p. 190). For the 1963-1973 period, the glacier is also marked on the sketch for the year 1973 (Šifrer, 1976, p. 238), and for the 1974-85 period, also for the year 1983 (Šifrer, 1986, p. 129). Since the snow surface cannot be discerned from the ice surface on these photographs, the size of the glacier cannot be measured. The size of the glacier for the missing years is not known. However, in the already quoted publications the following sizes of the glacier in hectares are stated:
| Year | Size (ha) | Leto | Size (ha) |
| 1946 | 14,73 | 1952 | 13,00 |
| 1947 | 13,96 | 1954 | 12,66 |
| 1948 | 16,00 | 1956 | 12,40 |
| 1949 | 13,97 | 1958 | 12,30 |
| 1950 | 13,29 | 1962 | 12,13 |
| 1951 | 17,78 | 1973 | 11,90 |
In the quoted Institute publications, tables are published with the measurement data on the distance of the glacier's edge from marker signs. When the upper edge dropped so much in the fifties and the sixties, that the surveyors could not reach marker signs on the steep slope, tables stated less and less frequently the fluctuation of the upper edge which would be necessary for the calculation of the glacier's size.
First marker signs along the lower end of the glacier were made on the north part of the so called lower snowfield, located northeast and north of Glava elevation (on the names of the glacier's parts, see the next chapter!).
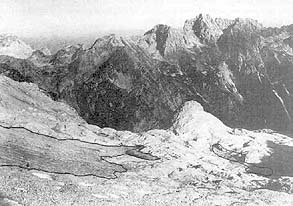
Fig.1 - In a century, the Triglav glacier has retreated, according to observations in the years 1993 and 1994, to approx. one tenth of its former size. It has retreated to the shady location under the Triglav crest only (the size of icefields is drawn according to coloured photographs). The autumn of 1994, when this picture was taken, was extremely unfavorable for the survival of snow and ice, which can be deduced from the fact that Mt. Škrlatica group in the background lacks its usual, permanent snowfields.
This snowfield filled in the depression which is called the depression of the lower snowfield on our schematic sketch. When this snowfield melted and roches moutonees were disclosed, the distances of the new edge of the glacier became too big. Therefore, extra marker signs were made on the south-facing sides of the above mentioned roches moutonees and a line or dot was added to each. In the years 1962-82, distances of the edge of snowfield were measured above all, without establishing whether there was ice under the snow or not. Towards the end of the eighties, the retreating lower end of the glacier broke into several ice belts in between the rocks of the so called central-glacier roches moutones and their altered distances from marker signs differed from point to point. The thinning of ice was ever more often registered with minimum lines drawn on rock tops. For September 1993 and 1994 when the glacier broke into several icefields, there are no more data on measuring the distances from the too distant lower marker signs. At the eastern edge where the scree was progressing while the ice was thinning, the glacier often narrowed and rubble spread (see Šifrer, 1976, p. 238 - sketch of the glacier, and Šifrer, 1963, fig. 36) although the ice most probably remained beneath.
On the top of the scree, rock debris often fall from the fissured limestone and roll down the depression below Mali Triglav peak. There runs a path to the mountain along it. On September 24, and 25, 1994, when the author of this paper, accompanied by a research assistant of the GIAM ZRC SAZU, Miha Pavšek, analysed the situation oh the glacier, it was possible to discover pure (water) ice at several places by digging into the rubble. Besides, some recent collapses of rubble in the central part of rubble margin disclosed the ice base.
From the available, published materials and from the Archives of the GIAM ZRC SAZU which keeps all documentary materials from 1946 to 1994, it was not possible, due to thc above stated reasons, to establish all annual sizes of the glacier, necessary to make comparison with the data from the meteorologic station.
In such situation, notwithstanding the existing photographs of which many show just the size of the snowfield, we had to, while establishing the glaciers fluctuations, rely on data about distances of the lower glaciers end from a certain point where measurement data are best coordinated with the rest of them, and are the most numerous. This is marker sign number 11. Since there is a knickpoint above it in the steep slope of the rocky bedrock, the snow fluctuated but a little in the 1964-71 and 1972-92 periods. Therefore, measurement data for these periods were taken from among the more flexible data of marker 12. Deviations at both marker points were unified to 100%. Some numbers from the published tables for the years 1963-73 (Šifrer, 1963) were rectified with the data from the text. For the rare missing measurements at these marker points interpolations were made on the basis of other data or photographs.
Thus, complete data for 38 years were established, but the distance of more than a hundred meters of the lower edge in 1993 and 1994 was not added, not to over-reduce the previous variations.
![]()
![]()
![]()