![]()
For the above mentioned climatic averages of the Kredarica station and the annual retreat of the lower end of the glacier, calculations of correlations were made by D. Perko, Ph. D., for which I would like to thank him. He calculated correlations for the changes in distance of the glacier’s end from year to year, and afterwards, for the deviation of the glacier’s end as to the 1955-92 periods average.
Table: Correlation coefficients of changes at the lower end of the glacier (markers 11 and 12).
Changes from year to year |
Deviation - 38-year average |
|
October-May precipitations |
0.1269 |
0.1846 |
June-August precipitations |
-0.0361 |
-0.1689 |
Maximum depth of snow cover |
0.0935 |
-0.1575 |
Average June-August temperature |
-0.4362 |
-0.5296 |
Average maximum May-September temperature |
-0.3178 |
-0.2942 |
Insolation hours |
-0.2465 |
-0.2138 |
With the 99% confidence level, the correlation between the average summer air temperature and the annual advance or retreat of the glacier’s end (-0.4362) is statistically significant. The correlation factor between the summer temperature and the deviation of the glacier's end as to the average over many years amounts to 0.5296. But with 95% confidence level, also the correlation between annual fluctuation of the glacier's end and the average maximum temperature of the May-September season becomes statistically significant. All other correlations are statistically insignificant. Irrelevance of total amount of precipitations in the October-May season can be explained by the fact that we are taking into account the lower end, while quantities of snow precipitations form snow/ice reserves on the upper edge of the glacier. That the summer temperatures are the principal factor of the glacier's fluctuation can be explained by the supposedly 200 in higher snow line in the past decades than the altitude of the Kredarica station is.
The relatively low statistical correlation derives from the measurements of distances from the markers to the glacier's edge or the snowfield's edge. Low correlation with the summer precipitations, which often occur in the form of snow also in June, but most of the time as rain, seems reasonable. However, it seems less reasonable with regard to the annual maximum depth of snow cover at the station. There were, on the average, 73 days with wind of 8 Beaufort or more, registered in the 1961-90 period, with the maximum in winter (see Table 3). This wind blows the surface snow away. The low correlation between the size of the glacier and the total sum of insolation hours in summer months may be due to snow cover of the glacier in the 1964-82 period when the extent of snow cover was influenced by the surplus of the past years.
In the light of the above mentioned most significant climatic elements for the balance of the Triglav glacier, we can establish, supported by the data from sonic older meteorologic stations, the fluctuations of the Triglav glacier in the second half of the past and the first half of this century.
Since fluctuations of monthly precipitations and monthly temperatures at Kredarica are relatively synchronous with those from the meteorologic station in Ljubljana (Gams, 1988) we can come to conclusions about the glacier on the basis of older data from this station; however, considering temperature fluctuations, conclusions can even better be made on the basis of the data from the meteorologic station of Trieste where the growth of the town has lesser impact on the rising of temperatures (Gams-Krevs, 1990; Ogrin, 1994). Regular observations in both stations began in the middle of the past century.
As to precipitations, until the beginning of the 1940's, their October amount, and subsequently also their annual amount, was larger than later. In the 1920's when the glacier was bigger again, October precipitations and annual precipitations were above the average, and concurrently a series of colder summers (Trieste) began, which lasted until the middle of the century. The decline in October precipitations, which at Kredarica mostly appear as snow, can be considered as an important cause of the post-war retreat of the glacier. Another cause was the drop in summer temperatures (particularly in Trieste) below the 150-year average, which lasted until the end of the 1980's.
Several photographs of the Triglav glacier from the inter-war period were published in Kugy's book (1938). Unfortunately, the dates when the photographs had been taken were not stated. The photographs between the pages 1/2, 136/137, 344/345 show a size such as often occurred after World War II, while on the photographs between the pages 48/49, 104/105, the glacier is larger. On the first photograph, the inclination of the surface at the transition of the central glacier's roche moutonnee is essentially steeper than the lower part of the glacier where a gentle step occurs. Better than on the photograph reproduction of a Pernhart painting in Meze's article (1955), the steep lower end of the glacier near the peak of the Triglav slope is seen on Kugy's reproduction of another oil painting by the same painter (p.112/113).
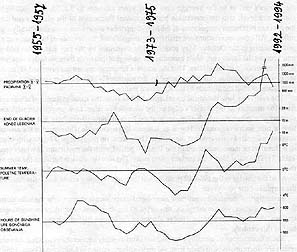
The lines proceeding from top downwards denote the three-year
moving averages for:
-the amount of precipitations from the previous autumn to the end of spring in the current
year, including May and October, on the Kredarica station;
-annual distance of the lower edge of the glacier from marker sign 11. In the years
1962-1982 the distances from marker sign 12 were taken into account, only that deviations
from the average were dimesioned upon the deviations from marker sign 11;
-average temperatures of summer months in degrees C (the Kredarica station);
-the sum of insolation hours in summer months at the Kredarica station.
To calculate the averages of the l931-60 series, there were but a few years with surveying data available for Kredarica. As to the interpolations then made for similar stations, it is worth comparing, regardless the small number of years, the averages (Pučnik, 1980; Furlan, l965) with the 1961-90 series (Archives). This comparison reveals that in the first series the average of precipitations (2149 mm) at Kredarica was by 153 mm higher. During this time, precipitations were lesser mostly in the following months: July-September, November-December, and March-April, and they were more plentiful in the rest of the months. In the accumulation season,1238 mm fell from October to May in the first series, and only 1157 mm in the second. The average annual temperature was equal in both series, i.e. - 1 .70C, but in the 1961-90 period the months from October to February were warmer, and the rest of the months were colder. These precipitation and temperature differences do not testify to worse conditions for the glacier in the recent series, if we disregard the reduced October and May precipitations.
A stronger correlation than the one mentioned above, calculated from the fluctuations of climatic elements and the changes of the lower end of the glacier, is presented on the diagrams of the three-year moving averages (the sketch) of the 1955-94 series. Parallels can be observed between the fluctuations of the distance of the lower end of the glacier from the marker sign 11 (in the 1964-82 years, marker 12) and the fluctuations of summer temperatures and insolation hours. Until the beginning of the eighties, summer temperatures were below the average, except for the average temperatures in the years towards the end of the fifties and at the beginning of the sixties. Similar is the trend of insolation hours. The congruence of summer temperatures and insolation hours is particularly increased by the frequency of summer anticyclonic weather when the air is dry and the temperature at the altitude of Kredarica (2500 m) is above the average (Gams,1988). Between 1962 and the end of the seventies summer temperatures were below the average. The size of the glacier follows this with delay. It was at its lowest at the end of the seventies when also the quantity of precipitations and the number of insolation hours were below the average. These are the years when the glacier was, except for two years, covered with snow imti 1 autumn. In such conditions the ice thickens under the snow which melts in summer. Therefore we can establish that with the average summer temperature below 4.20C and the average precipitations in the accumulation season, the glacier is stationary or it even gets thicker. This is not to be necessarily understood that with this, the snow line drops to the middle of the glacier (about 2450 m), for the glacier receives extra snow due to its lee location and snow sliding from the surrounding slopes; besides, it lies in the shadow of the neighboring elevations, while the snow line is defined on a level, unshaded surface.
In the seventies and at the beginning of the eighties (Šifrer,1989) it happened several times that the snow cover on the glacier thickened, while in the second half of the eighties the ice in the base thinned. This was the result of the increased summer temperatures. The average summer temperature at Kredarica in the 1961-90 series was 5 .00C, and in the 1981- 90 series, it was 5.40C. In the nineties, the size of the Triglav glacier has come to its lowest in the past century and a half. Climatic averages for the 1992-94 and 1961-90 years are as follows:
| 1961-90 | 1992-94 | 1992-94/ 1961-90 |
|
| Precipitations October-May | 1156 mm | 1167 mm | 101 |
| Precipitations June-August | 642 mm | 645 mm | 100 |
| Maximum depth of snow I-XII | 690 cm | 318 cm | 42 |
| Insolation hours VI-VIII | 177 | 197 | 111 |
| Temperatures VI-VIII | 5,0 | 6,6 | 132 |
| Temperatures in May | -0,2 | +1,6 | |
| Daily maximum temperatures, V-IX | 7,3 | 7,5 | 103 |
The years 1992-94 are characteristic, if compared with the 1961-90 series, for warmer and sunnier summers and considerably warmer May and low annual maximum of snow depth. The combination of much warmer months from May to August and average precipitations in the accumulation season occurred for the first time in the 1992-94 period in three consecutive years, since before this, warmer summers had usually coincided with greater quantity of precipitations in the accumulation season. The average temperature in May 1991, when the glacier thickened, was -3.70C, and in the following years, between 0.9 and 1.80C. Thus the season of intense ice melting began a whole month earlier. The average daily maximum temperature in May was 2.30C in the 1961-90period, and 3.50C in the years 1992-94. Hence, the extremely low maximum annual depth of snow (205 cm) in 1993.
The unfavorable beginning of the nineties was interrupted by precipitations in the accumulation season between October 1990 and May l991 (1705 mm), when the ice at the lower end of the upper icefield thickened by 1.7 m if compared with the previous year.
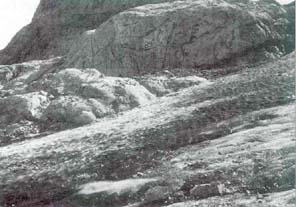
On the almost vertical 3.4 m high slope of the roche moutonee in the middle of the lower edge of the upper icefield, ice levels were marked in the 1987-94 period, which show the following changes in the thickness of ice from year to year:
Year |
Thickness |
| 1988/89 | decline by 40 cm |
| 1989/90 | decline by 26 cm |
| 1990/91 | increase by 172 cm |
| 1991/92 | decline by 143 cm |
| 1992/93 | decline by 163 cm |
| 1993/94 | decline by 10 cm |
The greatest disintegration of the glacier took place in the 1987/88,1991/92, and 1992/93 glacier years, and this situation did not improve in the next two years. Upon the estimated size of about 4 hectares, the Triglav glacier together with its eastern seree, hardly deserves to be called a glacier. Since the ice retreated from the plateaux, the glacier has had an explicit piedmont location in the shelter of the Triglav slopes. Together with this, the significance of avalanches for the glacier budget has increased and the glacier is acquiring ever more explicitly the features of an avalanche-type glacier (in the sense of Wilchelm, 1975, p.135).
Fig. 2 - On the rock in the background, the lines and year numbers show the thinning of ice at the contact of the upper icefield and central-glacier roches moutonees: gradual decline between 1987 and 1990 (this number is more to the right), then increase until 1991, and decline again until 1993 (marker sign in the middle of the picture is on the lower roche moutonee by the ice which is in the lower half of the picture dissected with water grooves and tossed with rubble). The roches moutonees are evidently well polished.
We do not know whether the worst combination of low precipitations in the accumulation season and high temperatures with high number of insolation hours in the melting season is going to continue. As the size of the glacier after the accumulation season of 1993-94 with above average precipitations ( l 336 mm) is but little changed from the previous year, it seems that with such precipitations and so extremely high summer temperatures as 7.90C, the upper icefield is almost stationary. An equally warm summer with only average precipitations would make the matter even worse. As the ice thickness in the upper icefield probably does not exceed 10 m, it would retreat further. With the possible "improvement” of the climate, it would take many years to cover central-glacier roches moutonees with the impermeable ice base formed from the melted snow cover each year. This would consequently accelerate the thickening of ice and thus the advance of the glacier to its former size.
![]()
![]()
![]()